The tables show the number of students from one university in Australia going to study in Europe and the number of students from European universities coming to study at the same Australian university in 2007 and 2009
The tables show the number of students from one university in Australia going to study in Europe and the number of students from European universities coming to study at the same Australian university in 2007 and 2009.
Summarise the information by selecting and reporting the main features, and make comparisons where relevant.
Write at least 150 words.
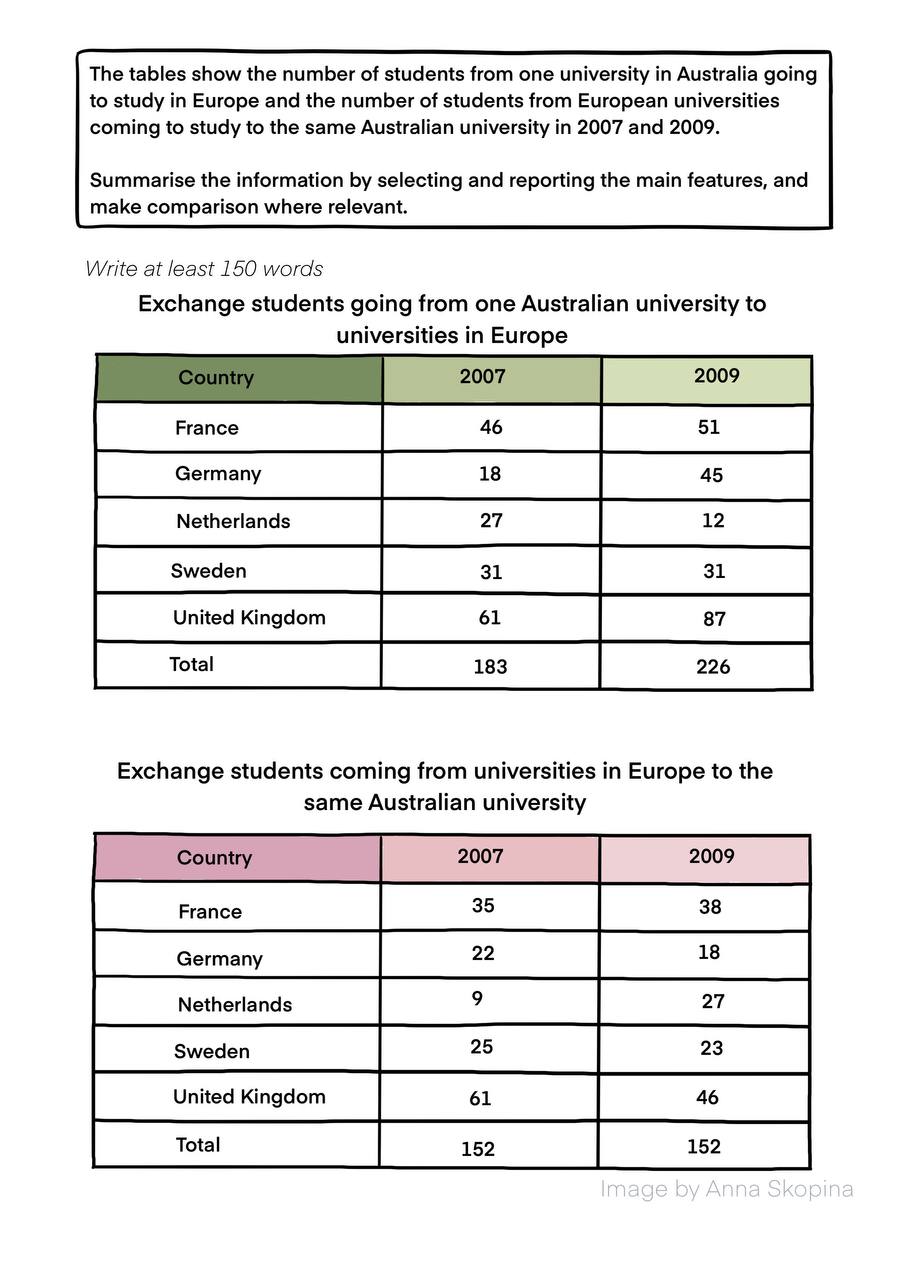
The two tables detail the data of exchange students from the Australian university to Europe and European pupils that enrolled to the Australian University in the years 2007 and 2009.
Overall, the data suggests that Australian students studying in Europe grew considerably, while the Europeans students coming to Australia did not change at all. Students from the United Kingdom formed the largest group of exchange students from and to Australia, while Germany had the highest growth rate of students leaving for other countries.
With respect to the Australian students studying in Europe, the total figure skyrocketed from 183 in 2007 to 226 in 2009. This was as a result of an increased intake in international students from the United Kingdom and Germany: from 61 to 87 and from 18 to 45, respectively. There was also a somewhat modest increase in France from 46 to 51, while the Sweden figure was stuck at 31. Most remarkably, the Netherlands was the only country to show a fall in numbers, with students going on exchange dropping from 27 to 12.
On the other hand, the amount of European learners in Australia stayed the same at 152 in both periods. There were, however, changes in particular nations. In France, the number of enrolled students increased slightly from 35 to 38, while those coming from the Netherlands increased threefold from from 9 to 27. In contrast, the United Kingdom recorded a substantial drop, with student numbers plummeting from 61 to 46. Germany also saw a minor decrease where the number of students opting for Australia fell from 22 to 18, while Sweden’s figures remained almost unchanged (25 in 2007 and 23 in 2009).

Комментарии
Отправить комментарий